Numerical Reasoning Tests
Register for Free
Register now for free to give yourself the best chance of passing your numerical aptitude tests
What are Numerical Reasoning Tests?
Numerical reasoning tests are standardised assessments used to evaluate a candidate’s ability to interpret, analyse, and work with numerical data in a workplace context. These tests typically involve graphs, tables, and charts, requiring candidates to apply percentages, ratios, averages, and data comparisons to answer multiple-choice questions. Often timed, they assess how efficiently candidates can solve problems under pressure, making them a key part of recruitment for roles in finance, banking, engineering, technology, business management, and the public sector.
Employers use numerical reasoning aptitude tests to assess critical thinking, problem-solving, and data interpretation skills, helping to shortlist strong analytical candidates before interviews or assessment centres. They provide an objective and efficient way to evaluate quantitative ability and predict job performance. For applicants, numerical reasoning test practice helps build confidence, offering a fair selection process where strong performance can enhance job prospects, even for those with limited work experience.
Register for free numerical reasoning aptitude tests to give yourself the best chance of passing your numerical tests for graduate schemes or other job roles.

Prepare Yourself for Leading Employers' Numerical Reasoning Tests


Numerical Reasoning Test Topics
The Pass Numerical Reasoning course is structured into three key areas—Numbers, Handling Information and Data, and Exam Technique—to provide a clear and logical progression in learning to help you succeed in your numerical reasoning assessment.
Unit 1: Numbers
The Numbers section develops core arithmetic abilities, such as fractions, percentages, ratios, and unit conversions, which are essential for solving workplace-related numerical problems. Candidates also learn about percentage change, compound growth, and financial calculations, helping them tackle business-related assessments used in online numerical reasoning assessments.
Unit 2: Handling Information and Data
The Handling Information and Data section focuses on interpreting graphs, tables, and statistical measures, ensuring candidates can extract meaningful insights from bar charts, pie charts, line graphs, and cumulative frequency graphs. Skills such as calculating averages and analysing trends are crucial for passing numerical reasoning tests.
Unit 3: Exam Technique
The Exam Technique section provides strategies for improving accuracy and time management in online numerical reasoning tests. With access to numerical reasoning test practice questions, candidates can refine their approach and gain confidence before sitting a numerical test for an interview.
How are Numerical Reasoning Tests Conducted?
🏛️ Structure & Provider of Numerical Reasoning Assessments
Numerical reasoning tests are typically taken online, either remotely or at a test centre, and are often an early-stage assessment in recruitment. They are commonly used for graduate schemes, apprenticeships, and professional roles requiring data analysis and problem-solving. These multiple-choice tests present numerical data in graphs, tables, and charts, requiring candidates to apply percentages, ratios, averages, and currency conversions. Online numerical reasoning test formats vary, but most contain 15 to 30 questions, depending on the provider and employer’s requirements.
⌛ Duration and Time Limits of Numerical Reasoning Assessments
Most online numerical reasoning tests last between 12 and 30 minutes, with strict time limits that require quick thinking and efficiency. Candidates usually have less than a minute per question, making time management essential. Some tests allow more time for complex data interpretation, while others are designed to assess how well candidates work under pressure. Practising with timed tests can help candidates develop speed and accuracy, improving their performance in real assessments.
Register for free numerical psychometric tests to give yourself the best chance of passing your numerical tests for graduate schemes or other job roles.

Numerical Reasoning Test Practice
Practicing numerical reasoning test questions is key to success. Using Pass Numerical Reasoning for numerical reasoning test practice questions helps you become familiar with different question formats, improve accuracy, and refine time management skills. Many tests are time-pressured, so regular practice ensures you can work efficiently under strict limits, reducing stress and boosting confidence. By consistently practicing and using numerical reasoning test examples, you strengthen core mathematical skills, making it easier to tackle workplace-related numerical challenges.
Click below to use our free numerical reasoning example questions to sharpen your core skills and familiarise yourself with the format ahead of taking your numerical reasoning tests, or register for to access our free numerical reasoning test mocks exams.
Free Numerical Reasoning Tests
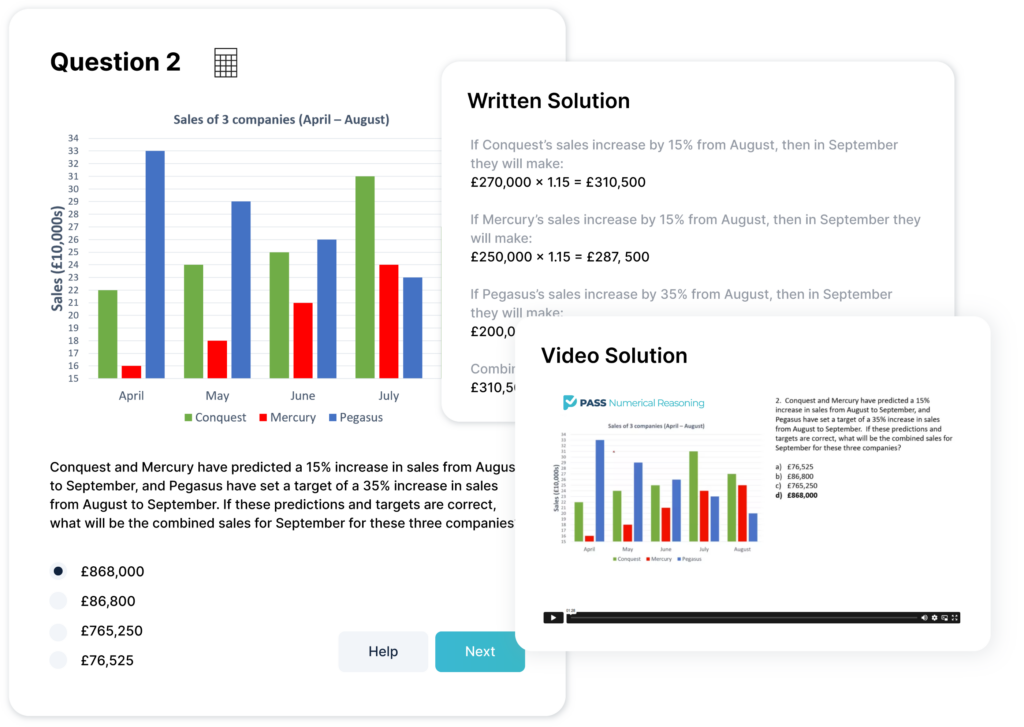
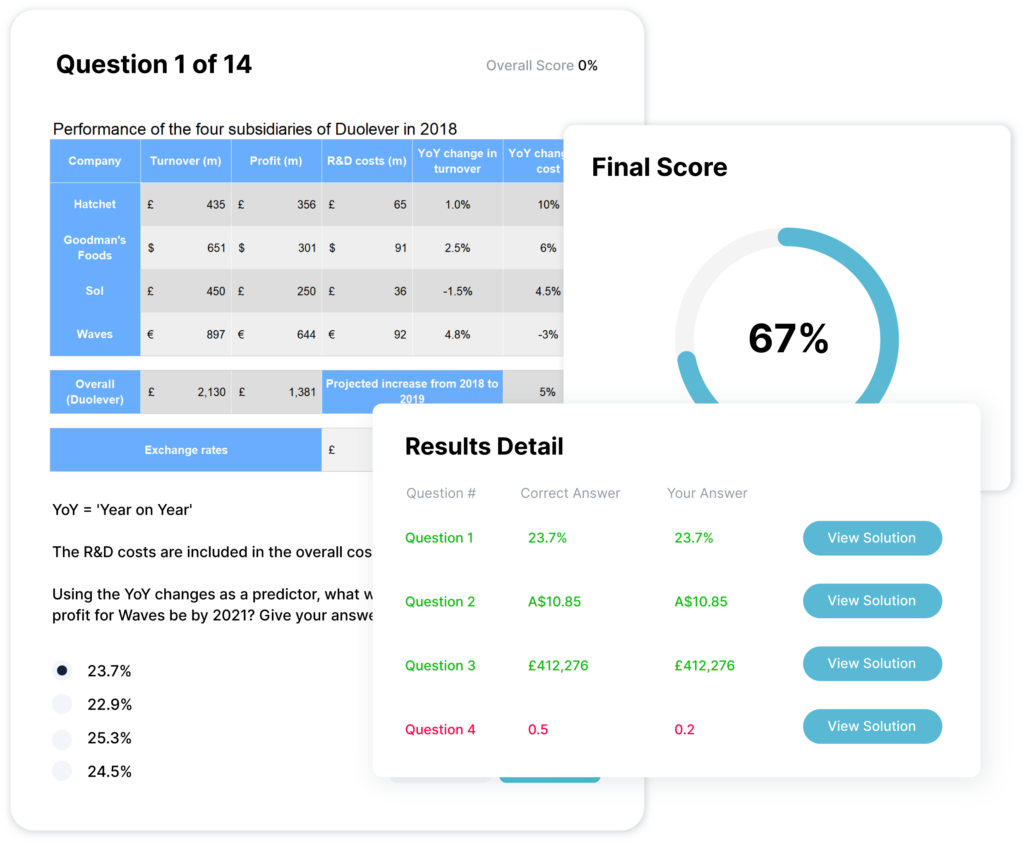
Give yourself the best chance of success in numerical reasoning tests by using our free online practice test, designed to reflect the format, timing, and question types commonly found in real assessments. The test includes 20 questions to be completed in 20 minutes, simulating the kind of pressure and pace you’ll experience during the actual application process. Questions are based on practical workplace scenarios and assess key skills such as interpreting data, calculating percentages, and working with ratios. To maximise your performance, it’s important to read each question carefully, double-check your calculations, and manage your time effectively. After completing the test, you’ll receive detailed written solutions and video walkthroughs to help you understand each answer and improve your technique for future attempts. This makes it an ideal way to build confidence and sharpen the skills needed to succeed in numerical reasoning assessments.
Register now to access our free numerical reasoning practice tests and give yourself the preparation you need to succeed.
Common Numerical Reasoning Test Providers
There are several numerical reasoning test companies that design numerical reasoning assessments for employers, each with their own format, difficulty level, and question style. Below are some of the most commonly used graduate numerical reasoning test providers and key information about them:
Aon/Cut-e
Aon, also known as Cut-e, offers modern numerical aptitude tests with a strong focus on gamification and speed-based assessments. These tests are usually shorter, lasting between 6 and 12 minutes, and involve quick problem-solving tasks. Aon/Cut-e tests are popular in the technology, engineering, and FMCG (Fast-Moving Consumer Goods) industries, where speed and accuracy are critical. Companies such as Rolls-Royce and Procter & Gamble frequently use these assessments.
Talent Q (Now Part of Korn Ferry)
Talent Q, now part of Korn Ferry, is known for its adaptive numerical psychometric tests that adjust question difficulty based on the candidate’s performance. These tests are commonly used in high-level corporate and executive hiring. Time limits vary, but candidates must process numerical data quickly and accurately. Many multinational organisations with complex recruitment processes use Talent Q assessments to ensure they select candidates with strong analytical and decision-making skills.
Kenexa (IBM Talent Assessments)
Kenexa, part of IBM Talent Assessments, provides in-depth numerical reasoning aptitude tests used primarily in banking, finance, and consulting industries. These tests generally last between 20 and 30 minutes and require candidates to interpret graphs, financial data, and logical sequences. Many financial and analytical job roles require strong numerical skills, making Kenexa tests a preferred choice for evaluating candidates in these fields.
SHL (Saville and Holdsworth Limited)
SHL is one of the most widely used test providers for online numerical reasoning tests, particularly in corporate recruitment. Their tests typically last between 17 and 25 minutes and consist of multiple-choice questions based on tables, graphs, and charts. Candidates are often given around one minute per question, requiring quick calculations and data interpretation. SHL numerical reasoning tests are used by companies such as PwC, Ford, and British Airways.
Cubiks (Now Talogy)
Cubiks, now part of Talogy, is well-known for its flexible and adaptive numerical reasoning assessments, which are often untimed or have generous time limits. These tests are widely used in public sector recruitment, such as for the UK Civil Service. Candidates are typically required to analyse numerical trends, ratios, and percentages in workplace-related tasks. Cubiks tests are often combined with situational judgement and verbal reasoning assessments to provide a more comprehensive evaluation.
FAQs on Numerical Reasoning Assessments
What are numerical reasoning tests?
Numerical aptitude tests are a type of psychometric assessment used by employers to evaluate a candidate’s ability to interpret, analyse, and work with numerical data. These tests typically include questions involving graphs, tables, and charts, requiring candidates to apply mathematical skills such as percentages, ratios, and averages to solve problems.
Why do employers use numerical reasoning tests?
Employers use numerical psychometric tests to objectively assess a candidate’s problem-solving abilities and data-handling skills, particularly for roles in finance, engineering, technology, and business. These tests help recruiters identify applicants who can confidently analyse numerical information and make informed decisions, ensuring they select candidates best suited for data-driven roles.
How are numerical reasoning tests conducted?
Numerical reasoning tests are typically taken online, either remotely from a candidate’s own device or at a designated test centre, depending on the employer’s requirements. These online numerical reasoning tests are usually time-restricted, lasting between 12 and 30 minutes, with candidates needing to answer multiple-choice questions based on provided numerical data.
How can I prepare for a numerical reasoning test?
Practising numerical reasoning tests is essential for improving speed, accuracy, and confidence. Candidates should familiarise themselves with common question formats, review mathematical concepts such as percentages and ratios, and develop effective time-management strategies. Make use of our free numerical reasoning test questions and solutions to practice for your numerical reasoning assessments.
Do you have any numerical reasoning test examples?
Practice for numerical reasoning tests with Pass Numerical Reasoning, with full worked numerical reasoning test examples, answers and solutions, as well as a comprehensive 3 hour video.
Register for free to access full mock numerical reasoning exams for free, to give yourself the best preparation for your upcoming numerical reasoning assessment.
Do you offer specific graduate scheme numerical test practice?
All of our resources, including free numerical reasoning test revision, are suitable for those who are preparing for their graduate numerical reasoning test, or a numerical reasoning test for any type of employer.